(Intensity) NDTMap Python Bindings
In addition to the SOGMM work, we also provide python bindings over the widely used Normal Distributions Transform (NDT) mapping work [1]. These python bindings were created for performance comparison with SOGMM. Thus, we made changes to incorporate intensity values in the regular grid. Our fork of the NDTMap repository is included in the dry workspace.
The setup for input data is the same as in the preceding tutorial.
If you use these bindings in your work, please cite the NDTMap paper [1].
Creating the NDTMap Model
Import the NDTMap and LazyGrid class and specify the input data.
%matplotlib inline
import numpy as np
import open3d as o3d

from sogmm_py.utils import read_log_trajectory, o3d_to_np, np_to_o3d
from sogmm_py.vis_open3d import VisOpen3D

from ndt_map import LazyGrid, NDTMap

frame = 1763
datasetname = 'lounge'

pcld_gt = o3d.io.read_point_cloud('./gira3d-tutorial-data/pcd_' +
                                  str(datasetname) +
                                  '_' + str(frame) +
                                  '_decimate_1_0.pcd', format='pcd')
pcld_gt_np = o3d_to_np(pcld_gt)

traj = read_log_trajectory('./gira3d-tutorial-data/' +
                           str(datasetname) + '-traj.log')
pcld_pose = traj[frame].pose

K = np.eye(3)
K[0, 0] = 525.0
K[1, 1] = 525.0
K[0, 2] = 319.5
K[1, 2] = 239.5

W = (int)(640)
H = (int)(480)
Specify the resolution for the NDTMap.
res = 0.02 # let us go with 2cm for this tutorial
l = LazyGrid(res)
n = NDTMap(l)
Load the ground truth point cloud into the NDTMap model and update the cells.
n.load_pointcloud(pcld_gt_np)
n.compute_ndt_cells_simple()
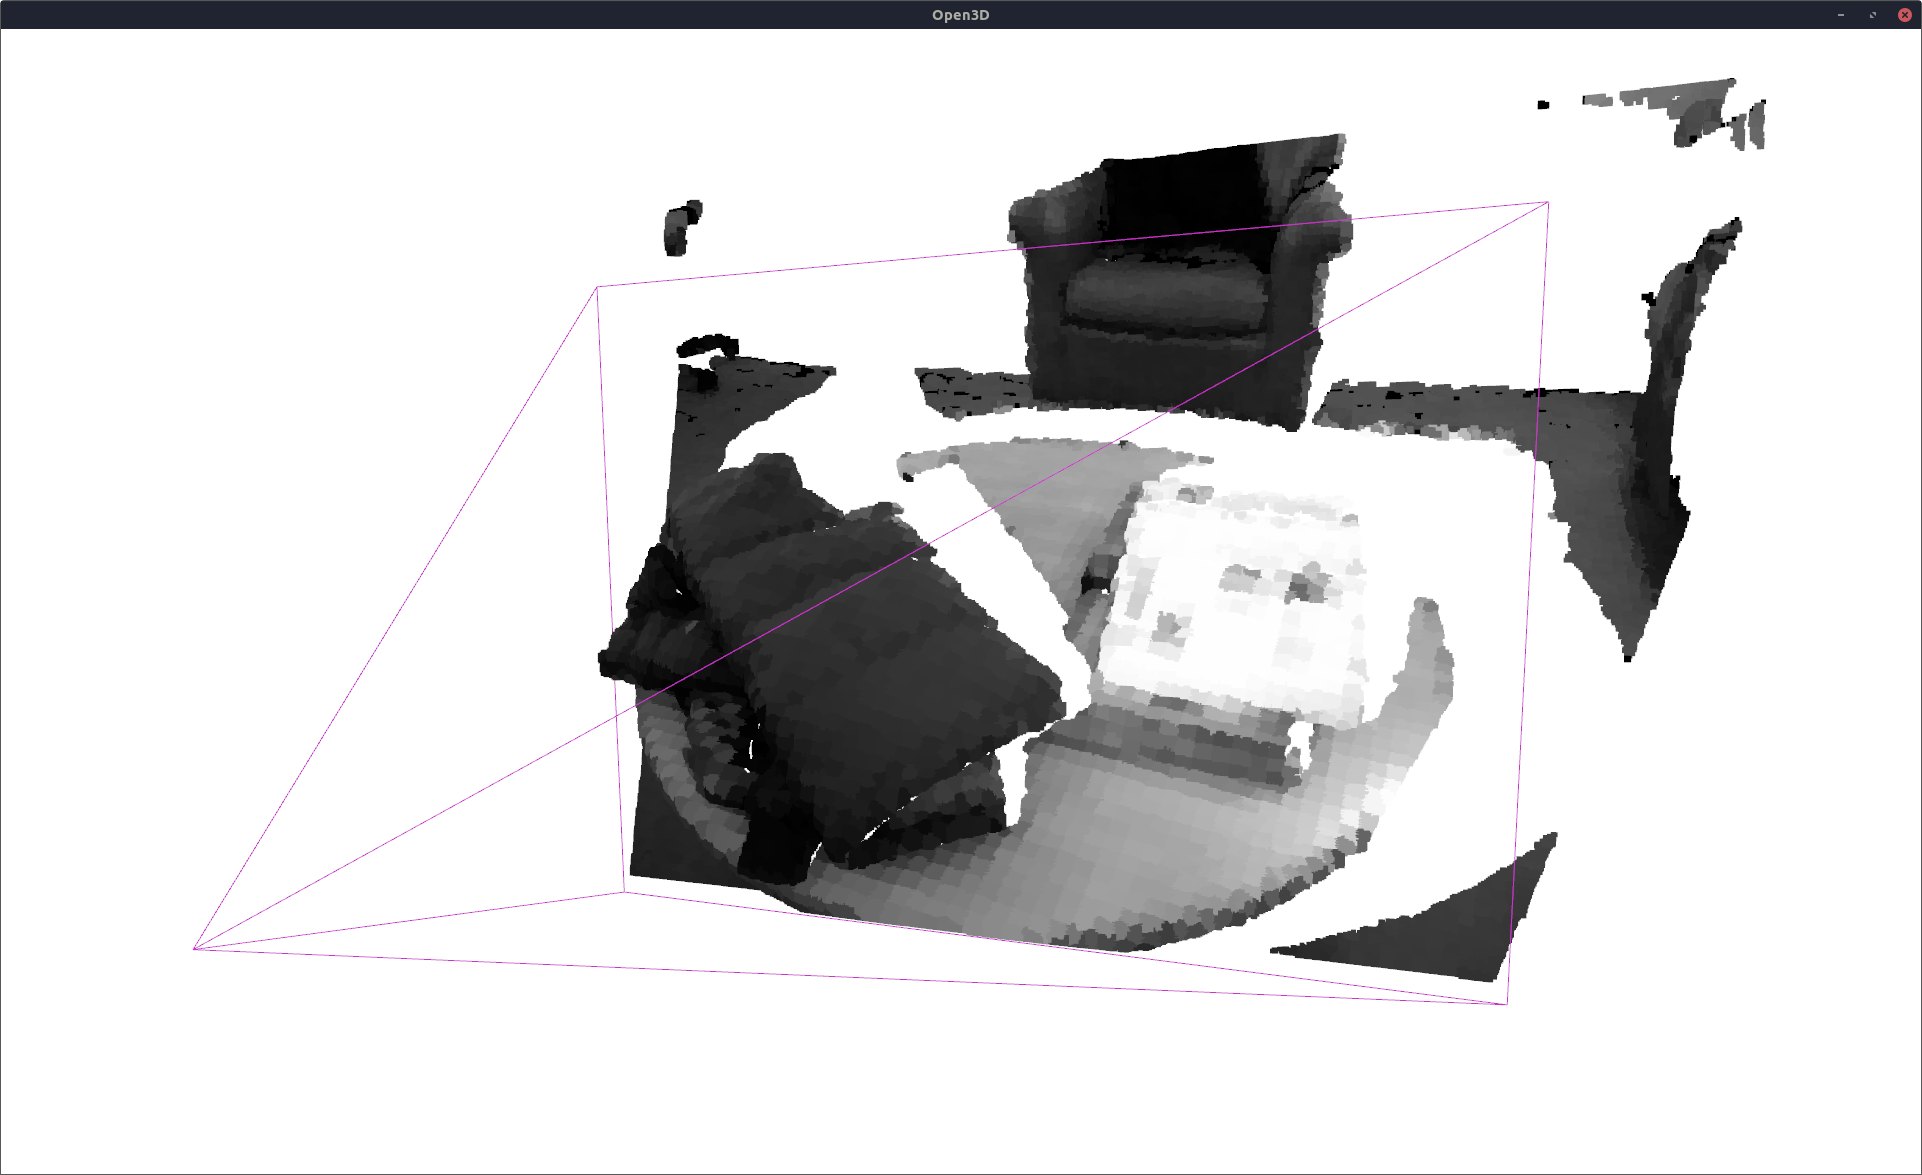
Inference for Intensity Image
For inference, we treat each cell in the NDT as an equally weighted Gaussian distribution.
recon_pcld = n.get_intensity_at_pcld(pcld_gt_np[:, 0:3])

vis = VisOpen3D(visible=True)
vis.visualize_pcld(np_to_o3d(recon_pcld), pcld_pose, K, W, H)
vis.render()
del vis

Dense Sampling for 3D Point Cloud Reconstruction
Same as the SOGMM case, this can be performed using the usual Box-Mueller sampling method [2].
weights, means, covs = n.get_gaussians()
weights /= np.sum(weights)
n_comps = np.shape(weights)[0]

from sklearn.mixture import GaussianMixture
from sogmm_py.utils import matrix_to_tensor
ndt_gmm = GaussianMixture(n_components=n_comps, covariance_type='full')
ndt_gmm.weights_ = weights
ndt_gmm.means_ = means
ndt_gmm.covariances_ = matrix_to_tensor(covs, 3)
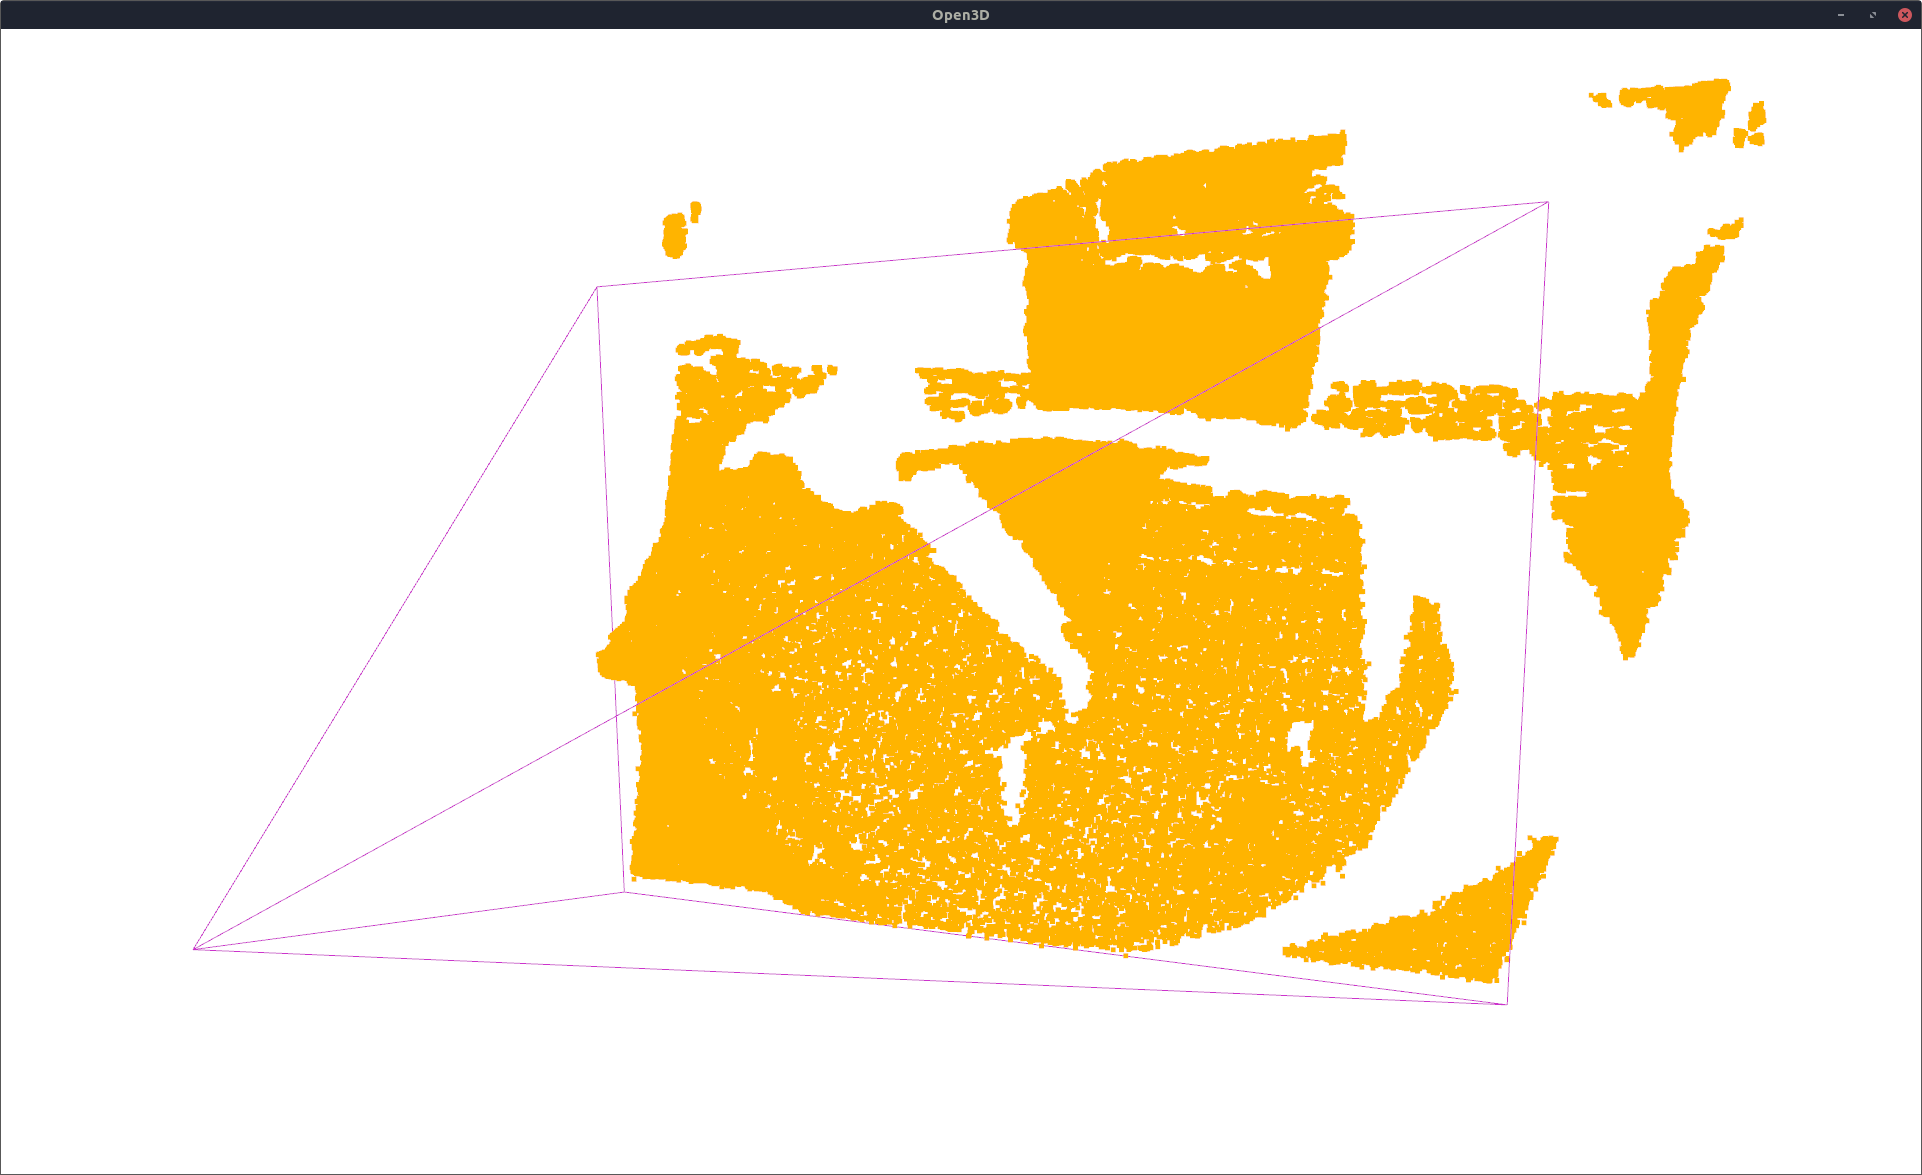
This GMM can be used for inference as in the SOGMM case. Let us visualize this output.
resampled_pcld, _ = ndt_gmm.sample(pcld_gt_np.shape[0]) # sample 4D points from the model
vis = VisOpen3D(visible=True)
vis.visualize_pcld(np_to_o3d(resampled_pcld), pcld_pose, K, W, H)
vis.render()
del vis

Performance Measures
Same performance measures are computed as in the SOGMM case.
from sogmm_py.utils import calculate_depth_metrics, calculate_color_metrics
fsc, pre, re, rm, rs = calculate_depth_metrics(pcld_gt, np_to_o3d(resampled_pcld))
print("fscore %f precision %f recall %f recon. mean %f recon. std. dev. %f" % (fsc, pre, re, rm, rs))

from sogmm_py.utils import ImageUtils
iu = ImageUtils(K) # image manipulation utility
_, gt_g = iu.pcld_wf_to_imgs(pcld_pose, pcld_gt_np) # project gt pcld on camera
if np.isnan(gt_g).any():
    gt_g = np.nan_to_num(gt_g)
_, pr_g = iu.pcld_wf_to_imgs(pcld_pose, recon_pcld) # project recon pcld on camera
if np.isnan(pr_g).any():
    pr_g = np.nan_to_num(pr_g)
psnr, ssim = calculate_color_metrics(gt_g, pr_g) # compare the intensity images
print("psnr %f ssim %f" % (psnr, ssim))
fscore 0.987417 precision 0.977499 recall 0.997537 recon. mean 0.002502 recon. std. dev. 0.003552
psnr 27.299248 ssim 0.813870
# computing memory usage
M = ndt_gmm.n_components
mem_bytes = 4 * M * (1 + 3 + 6)
print('memory %d bytes' % (mem_bytes))
memory 227600 bytes
References
[1] J. P. Saarinen, H. Andreasson, T. Stoyanov et al., “3D normal distributions transform occupancy maps: An efficient representation for mapping in dynamic environments,” The International Journal of Robotics Research, vol. 32, no. 14, pp. 1627–1644, Dec. 2013 [2] C. M. Bishop and N. M. Nasrabadi, Pattern recognition and machine learning. Springer, 2006, vol. 4, no. 4