Python
Overview
The gmm_occupancy_modeling_examples package contains python scripts
for sampling from GMMs and updating an occupancy grid map for an
entire dataset of a mine.
Initialize the Python Environment
To initialize the python paths properly, you should source workon
at the top level sandbox directory.
cd gira3d-occupancy-modeling
source workon
Download Data
The data directory contains a script that you will need to execute
in order to download all of the data associated with this tutorial.
pip install gdown
cd gira3d-occupancy-modeling/data
./download.sh
The complete dataset is < 200MB so it should download fairly quickly.
Running the Example
Go to the gmm_occupancy_modeling_examples/python directory
under wet/src and run the occupancy_modeling_example.py file.
cd wet/src/gmm_occupancy_modeling_examples/python
python occupancy_modeling_example.py
Detailed Explanation of the Script
First, we initialize the Grid3D data structure.
p = Parameters()
with open('../config/grid3d.yaml') as file:
    params = yaml.safe_load(file)
    p = convert_dict_to_params(params)
TRIMMED_MAX_RANGE = MAX_RANGE - p.resolution
OCCUPANCY_THRESH = p.occupancy_threshold

grid = Grid3D(p)
Next, the GMMs are load from file and points are sampled.
gmmfile = GMM_DIR + str(i) + '.gmm'
gmm = load_gmm_from_file(gmmfile)
ret = gmm.sample(2e4)
pts = ret[0]
The points are transformed into the world frame using the
ground truth data stored in odometry.pkl.
R = Twc[0:3, 0:3]
t = np.reshape(Twc[0:3, 3], (3,1))
pts = np.matmul(R, np.transpose(pts)) + np.matlib.repmat(t, 1, np.shape(pts)[0])
Each point is raytraced through the occupancy grid map
for j in range(0, np.shape(pts)[0]):
    st = Point(t[0,0], t[1,0], t[2,0])
    en = Point(pts[j,0], pts[j,1], pts[j,2])
    grid.add_ray(st, en, TRIMMED_MAX_RANGE)
Finally, the occupied points are recovered from the occupancy grid map and visualized.
n = p.width*p.height*p.depth
all_pts = None
for i in range(0,p.width*p.height*p.depth):
    if grid.get(i).logodds > OCCUPANCY_THRESH:
        pt =  grid.get_point(i)
        if all_pts is None:
            all_pts = np.array([pt.x, pt.y, pt.z])
        else:
            all_pts = np.vstack((all_pts, np.array([pt.x, pt.y, pt.z])))

viz = Open3DVisualizer()
viz.plot3d(all_pts)
The expected output is:
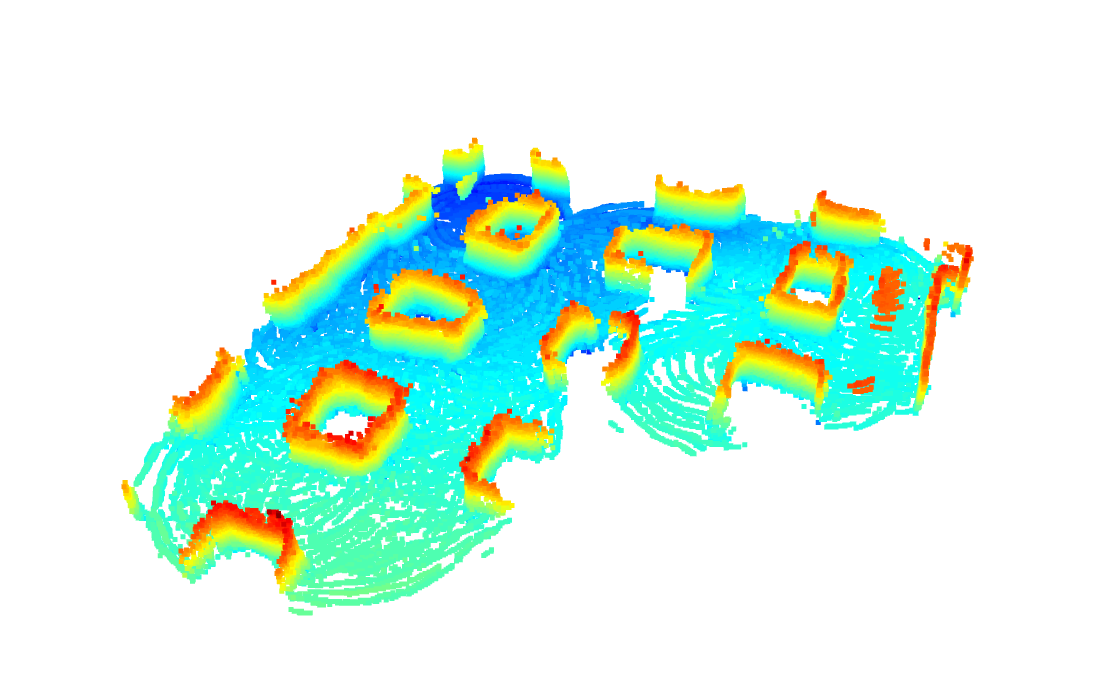 which plots the points that exceed the occupancy threshold
from the occupancy grid map.
which plots the points that exceed the occupancy threshold
from the occupancy grid map.
Creating GMMs using Sklearn
A script is provided to learn GMMs using sklearn.
In order to do so, you will need to install scikit-learn.
pip install scikit-learn
The script is provided in the
gmm_occupancy_modeling_example/python/utils/create_and_save_gmm_example.py script.
python create_and_save_gmm_example.py
The GMM will be saved in your current working directory.
Operating Systems
These tutorials have been tested on the following operating systems:
- Ubuntu 20.04
- Ubuntu 18.04